Automated Financial Analysis Tool
A full-stack financial analysis platform that consolidates bank accounts, brokerage portfolios, and real-time market data into a unified dashboard with automated technical analysis and live streaming.
Features
- Unified Financial View: Aggregates data from multiple sources (bank accounts via GoCardless, Trading212, and SnapTrade brokerages)
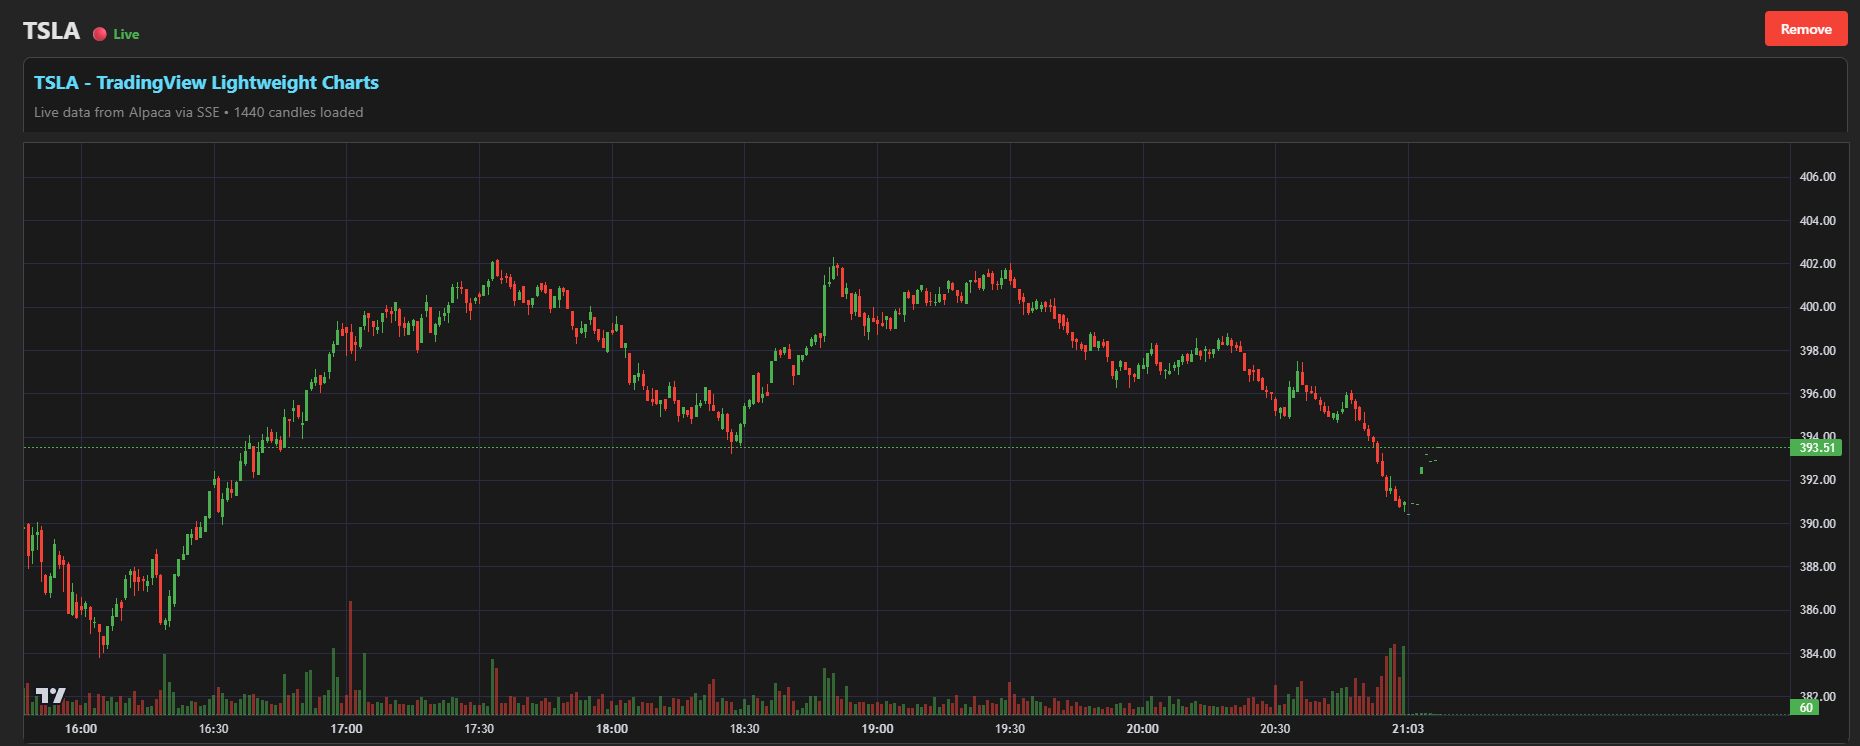
- Live Market Streaming: Real-time stock data via Alpaca API with Server-Sent Events (SSE) for 1-minute OHLCV updates
- Advanced Analytics:
- Sentiment analysis of market news
- Hidden Markov Models for market regime detection
- Technical indicators including moving averages
- Portfolio Tracking: Live portfolio visualization synchronized with your actual brokerage holdings
- Dual Database Architecture: Fast local DuckDB queries with PostgreSQL persistence
Tech Stack
Backend
- Python & FastAPI
- DuckDB (local caching)
- PostgreSQL (persistent storage)
- Modal (serverless deployment)
- Azure Containers
Frontend
- React & TypeScript
- Vite
- Deployed on Vercel
APIs & Integration
- Alpaca (market data)
- GoCardless (banking)
- Trading212 & SnapTrade (brokerages)
- Supabase (authentication)
- Kraken (crypto data)
Architecture
The backend processes live market ticks from Alpaca API, transforms them into 1-minute OHLCV bars, and streams updates via SSE. Market data flows through a two-tier storage system where DuckDB handles high-speed local queries while PostgreSQL maintains persistent historical records with periodic upserts.
The frontend provides real-time visualization of market movements, synchronized portfolio positions, and connected bank account balances in a single interface.